It’s the holy grail of gun control activists: proof that more guns equals more crime. Quantitative evidence that the mere existence of firearms increases crime, therefore justifying the disarmament of Americans. A study claiming to have reached just that conclusion came out last week, and naturally all of the usual suspects are jumping all over it. The study, produced by Stanford University, may make some interesting claims but even the press release touting it notes that it just might all be a wild-ass guess . . .
From the presser:
The murder rate increased in the states with existing right-to-carry laws for the period 1999-2010 when the “confounding influence” of the crack cocaine epidemic is controlled for. The study found that homicides increased in eight states that adopted right-to-carry laws during 1999-2010.
[…]
“Different statistical models can yield different estimated effects, and our ability to ascertain the best model is imperfect,” Donohue said, describing this as the most surprising aspect of the study.
He said that many scholars struggle with the issue of methodology in researching the effects of right-to-carry laws. But overall, his study benefits from the recent data.
Donohue suggested it is worth exploring other methodological approaches as well. “Sensitive results and anomalies – such as the occasional estimates that right-to-carry laws lead to higher rates of property crime – have plagued this inquiry for over a decade,” he said.
The problem is that the study appears to use a complex model to “control” for other factors, like the “crack cocaine epidemic.” But when you are looking at a complex system like crime in the United States, controlling for different variables is extremely hard and often impossible. That’s why they went ahead and hedged their own announcement, making sure to mention that their model might be imperfect.
In fact, in the study itself, the authors admit that they only have a 10% confidence in the validity of the outcome:
Across the basic seven Index I crime categories, the strongest evidence of a statistically significant effect would be for aggravated assault, with 11 of 28 estimates suggesting that RTC laws increase this crime at the .10 confidence level. An omitted variable bias test on our preferred Table 8a results suggests that our estimated 8 percent increase in aggravated assaults from RTC laws may understate the true harmful impact of RTC laws on aggravated assault, which may explain why this finding is only significant at the .10 level in many of our models.
Here’s a little tip: if the strongest indication from the study you’re performing indicates that the results you want to see (guns = crime) is only present in less than 50% of your results (11 of 28 estimates above), then you might not want to trumpet that result from the rafters.
The reason HuffPo is crying Eureka! is that studies “proving” that guns result in more crime are about as rare as studies “proving” that climate change doesn’t exist. Both are hot-button issues based on complex systems and long term trends, and neither are particularly convincing to scientists and statisticians in general. In this case, the researchers themselves seem to be heavily couching their findings due to the extremely tenuous level of confidence.
So I only needed one chart to debunk the results of the Stanford study:
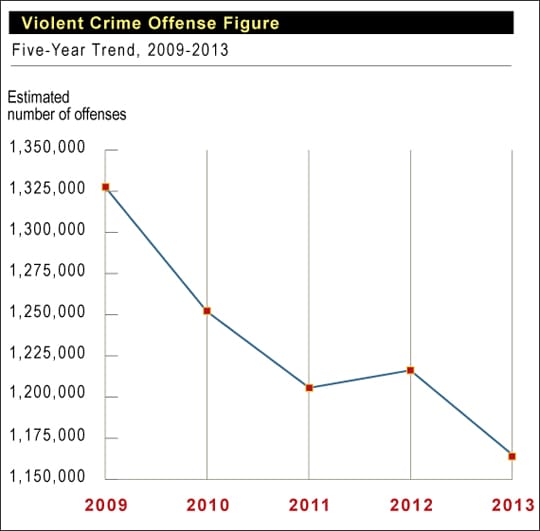
I’m not sure how the authors (or the breathless journalists reporting it) can claim an increase in violent crime when violent crime in the United States has been dropping for two decades at the same time firearm sales are at historic highs. I take that back — I know exactly how they can do that. If you know the results you want and the study is sufficiently long, you can make it say whatever you want. Even if you need to drop the confidence interval to hilariously low levels and ignore half of your results.


I didn’t note the .1 confidence when I saw this study – that’s abysmal!
On the topic of lies, damn lies and statistics, your chart has a non-zero axis – always a red flag.
It’s still a 14% reduction in violent crime, despite what I would assume is much greater than a 14% INCREASE in the number of guns sold/owned in the U.S.
Carry that graph back to ~1996 and the results are even better. I think we’re at ~40-50% of the violent crime compared to that time frame.
at least its not a dual y axis plot. i have seen those used to embellish more non-relationships between two trends than i can recall..
10% confidence is literally not even worth mentioning. The only reason that this went to the Internet, and not to a peer reviewed journal, is because no journal would ever accept a study with this abysmal of an outcome. If a researcher put out an article saying that they have been doing preliminary modeling working with a 80% confidence and achieved a good result with further exhaustive study planned, journals MIGHT have a desire to publish, just as a note to startup research out there looking for further grants or investments.
This is absolute drivel, worthy of being picked up by the National Enquirer at best.
The Enquirer has too much journalistic integrity to pick it up.
When you’re pushing a logically, factually flawed and failed agenda to the uninformed masses, any straw will do, particularly where you also control the message, as the ‘progressive’ anti-gun legacy media does.
Sigh. So it continues. This “study” will now be touted by all the anti-freedom fanatics for the next 20 years like the Kellerman (fantasy) study.
Ha! 90% probability of chance? Any real scientific study wouldn’t take more than 5%. Leave it to social scientists trying too hard to prove a point.
Complex model, maybe, but more likely reporting bias. How many of those crimes were CCW holders?
More likely, the increase of CCW has lead to an increase in the *reporting* of aggravated assault. It does not mean that there are fewer cases. It just means that You don’t report aggravated when you are carrying an illegal weapon. Now that the weapon is legal, probably you do.
Again how many by CCW holders? Very few.
If you need a case in point about reporting bias, look at the 3x increase in rape in the FBI stats since 1968. It’s more acceptable to report rape today. It’s not more common.
Remember, crime reporting to a large extent is voluntary – both by victims and municipalities. Anything that makes it more likely to report a crime makes it appear that the crime is more likely.
dwb,
The importance of your statements are huge. There are lots of reasons why people would not report crimes. As you pointed out, the victim may have used a firearm to defend themselves but their ownership or possession could land them in jail so they never report the crime. Some victims fear retribution from the attacker if they report the crime so they will not report it. Other victims do not trust the police. Still other victims may want to exact retribution themselves at an opportune time thus they will not report to police. Whatever the reason, there are lots of them and those reasons could change and lead to more people actually reporting the crimes that happened to them.
The funny thing about this study is that it did not point to the one type of crime that probably does increase: property crime (eg auto theft). When they can’t rob you directly they rob your things when you’re not there. Of course, id rather not be robbed or burglarized. But if I am, id rather not be threatened. If CCW results in “non confrontational” crime like burglary and auto theft vs robbery and carjacking, im ok with that. Seems like kind of the idea: protect people.
Also depends a lot on what you call “crime.” Not to mention location.
We used to say that statistics don’t lie, but that is certainly not true. The lie is in how those statistics are gathered and then again in how they are used.
Figures don’t lie, but liars figure.
from:
http://onlinestatbook.com/2/estimation/confidence.html
“If repeated samples were taken and the 95% confidence interval was computed for each sample, 95% of the intervals would contain the population mean.
A 95% confidence interval has a 0.95 probability of containing the population mean.
95% of the population distribution is contained in the confidence interval.”
the study is a huge waste of time and money. the researchers concluded that there is a 0.10 probability that the data they are trying to present will be/are present in the array of data points.
but again, facts are irrelevant; emotion trumps all, and we have no effective answer for that.
Confidence intervals and confidence levels are two different things…
http://www.surveysystem.com/sscalc.htm#one
But still, a 10% confidence level is statistically laughable.
i don’t think i’ve ever even heard of someone publishing anything at such a low level.
calling it “laughable” is an understatement.
Donahue’s anti-gun fanaticism and academic dishonesty have been well documented. His past polemics masquerading as research have been thoroughly discredited. He’s an abject embarrassment to Stanford and serious thinking individuals everywhere.
Google him, don’t take my word for it.
This “study” has no authority whatsoever (a 10% confidence interval means the results are utterly and totally meaningless).
More importantly, we have to prevent the other side from defining the narrative. In this case gun grabbers are trying to make the right to own firearms dependent on some net “gain” to society — of course gun grabbers will define whatever that “gain” is as well as the method to calculate it.
We cannot ever tie any of our rights to anyone’s portrayal of a net “gain” to society. Otherwise, we can eliminate almost everything.
Correction: replace the word “interval” with the word “level” in my first sentence.
This is a very good point. Even if this study were 100% reliable, with accurate, repeatable results, it shouldn’t matter. Human rights are not dependent on whether or not those rights benefit society; they benefit the individual, and that is enough to justify their existence.
Including you. Because one less mouth to feed is a net gain to society.
/sarcasm.
Actually, Chris, what you say is no joke at all. There are people who view human life as having a negative impact on the world because we consume natural resources. This is the justification of self-appointed elitists to eliminate “undesirables”.
No doubt such people will hold most or all positions on Obamacare’s death panels.
“Controlling” for crack? Is this not a tacit admission that the drug war skews the applicable data? Is this not the same thing that we have begging them to do, to ignore intra-criminal homicide and compare THAT number to countries with similar demographics? So they will do it in a heartbeat when it will show a microscopic increase in non gang/drug related crime, but never when it shows a decrease in homicide and demonstrates their own misguided faith in european gun control.
Its the nature of statistics. When everything is centered around probability and confidence levels, if you conduct any study enough times you’ll get one that reflects the complete opposite of reality.
People need to understand if you have 20 studies, and 19 say one thing and 1 says the other….the cheese standing by itself is almost certainly NOT giving a valid result..
And if someone claimed a statistical relationship where castrating males reduces sexual assault, should we castrate many/most males?
If having balls is a crime, only criminals will have balls?
The fact that a .10 confidence level means nothing isn’t the point of their claims. They know that, while people who know statistics will dismiss it outright, many people either don’t know or don’t care about math enough to think about what the results mean, and will just say, “Hey! They did a study, and include numbers! They must be correct!”
“Look at this baby!” has become “Look at this chart!”
Yes.
The new term for this is Gruberism.
Jonathan Gruber is truly ‘the gift that keeps on giving’
I’m gonna have to buy popcorn by the kilo when Congress has him explaining himself on CSPAN…
News flash for liberals and Stanford / John Hopkin’s “I hate guns and that’s my opinion” people. I am not a statistic. Our rights and freedoms should not be dictated or under scrutiny due to findings on the basis of “statistics.”
You give me a study from Stanford and John Hopkins (two notably bias organizations against guns) so here is a study for you:
http://news.nationalpost.com/2011/11/20/statisticians-can-prove-almost-anything-a-new-study-finds/
I gladly accept a higher or lower crime rate (don’t care) on the basis of your honest or bogus statistics. My rights and the rights of others should not be dictated or under scrutiny because of national trends or anyone’s opinion. Our rights should not be judged because of the actions of a few. Actions matter. Guns do not. People with guns are not criminals. People injuring, harming, robbing, or otherwise infringing on the rights of others are. America has long been based on the premise of “freedom.” If you are wishing America was more like “insert country here” because “insert freedom here” should not exist. Why don’t you go and move to that other country. Freedom is not for you.
Based on how the authors use the phrase “.10 confidence level” (and similar phrases like “10% level”) in the article, I think the number .10 is referring to the alpha level (significance level) of the statistical test used. The alpha level is…
“…the probability of rejecting the null hypothesis when the null hypothesis is true. Translation: It’s the probability of making a wrong decision.”
See: http://blog.minitab.com/blog/michelle-paret/alphas-p-values-confidence-intervals-oh-my
Note the same source also states that the alpha plus the confidence level (expressed as a decimal) must equal 1.
Anyway, when the study authors reference the .10 level or the 10% level, they are likely implying a confidence interval of 90%.
The study is still crap, but to say that the authors are only 10% confident in the results seems to incorrect. It is also very sloppy writing, but I digress.
Even if that’s the case… only 39% of the estimates (11 out of 28) would indicate a 90% confidence level.
61% of the estimates say the results are bull s**t.
In other words…
Darren, you have the right idea. A “confidence level” doesn’t refer to the percent confidence in the results (indeed, “percent confidence in results” is pretty meaningless as a phrase). A confidence *level* and confidence *interval* are complementary ideas in statistics. When a result falls below a particular confidence *level* (often 0.05 is the standard used in the literature, while 0.10 is sometimes used) then there is strong evidence that the result is real and not just an artifact of the sampling process. The smaller the level, the stronger the evidence.
Instead of worrying about the 0.10 confidence level, I’d be more concerned about the author’s fishing around for the right model. The fact that the estimate is so sensitive to the model choice appears to be the real issue with this study. If the effect can’t be reliably nailed down when the model is changed, then there is a problem with the data, the models, or both.
In other words, they found that more guns mostly has no effect. Yawn.
Are they referring to a p value when they talk about a .10 confidence?
In which case:
An informal interpretation of a p-value, based on a significance level of about 10%, might be:
p \leq 0.01 : very strong presumption against null hypothesis
0.01 < p \leq 0.05 : strong presumption against null hypothesis
0.05 0.1 : no presumption against the null hypothesis
http://en.wikipedia.org/wiki/P-value
DrVino: “Are they referring to a p value when they talk about a .10 confidence?”
Not exactly, but the ideas are related. When the p-value of a statistic falls below the chosen confidence level, then the result is said to be statistically significant at that level. So, in this study, when the authors talk about results holding at the 0.10 level, they mean that their estimate produces a p-value that falls below 0.10. They are a little cautious about this result because the “gold standard” in literature is to get estimates with p-values below 0.05. But that’s a somewhat arbitrary boundary, and reporting statistically significant results at the 0.10 level is pretty common in social sciences.
I think they are talking about p-value. Basically, it means that 1) if there truly is no effect, i.e., no underlying association between violent crime and firearms law, and 2) a bunch of (often untested) assumptions regarding the data are true, then one would expect to observe correlations as strong or stronger in fewer than 10 out of 100 randomly drawn samples. Basically, “How likely am I to have observed a correlation this strong if there really isn’t anything going on, assuming I’ve used the right models?”
Another issue is multiple comparisons. If you get 28 bites at the apple (i.e., attempt to associate 28 crime stats to the same variable), there’s a much better probability of getting a few hits (low p-value results) just by chance, even if nothing is going on. The conventional criterion for statistical significance is p < .05, but one would generally adopt a stricter criterion (not more lax) in situations like this with multiple comparisons all tested toward the same hypothesis.
That's putting aside all the fun issues with various flavors of regression analysis. Correlation =/= causation even for very simple models, as most people understand. In addition, interactions can change greatly depending not only on the full set of variables one includes, but also on the order in which they are entered into the model. More often than not, such effects are difficult or impossible to interpret.
These types of analyses have their place, and sometimes it's the best one can do. However, they are much better for generating hypotheses that can then be tested by actual experiments.
FTA:
In other words: there’s absolutely no correlation.
You can pretty much correlate anything to anything else at a 10% confidence level.
Show me your results at a confidence level of at least 90%, or go home, because you’re drunk.
As Mark Twain and others have stated time and again: “There are three kinds of lies: lies, damned lies, and statistics.”
Sam might have added a fourth level for anything related to correlational analyses in particular, though I guess it wouldn’t have been as poetic.
one of the ‘scholars’ who crafted this nonsense, Alexandria Zheng of Johns Hopkins, a university that is heavily indebted to Mickey Bloompansyfuckberg, should tell all as to the ‘impartiality’ of this study push-poll-like propaganda with ‘scientific’ gloss.
all these sociopathic nerds, will be the end of us all.
Nick,
Don’t get so caught up in others’ analyses that you make mistakes yourself. The graph you presented to “debunk” the study has, from a test design standpoint, no relevance to the issue “the effect of adoption of RTC laws on crime”. If anything, your graph indicates something that must be controlled in order to draw a reasonable inference about the issue addressed in the paper.
I would highly recommend to those interested in statistical analysis that you read the abstract of this paper. It is as much of a capitulation by a anti-gun academic (who is not in the medical field) as you are likely to come across. Here are some highlights:
“Our paper highlights some important questions to consider when using panel data methods to resolve questions of law and policy effectiveness. We buttress the NRC’s cautious conclusion regarding the effects of RTC laws by showing how sensitive the estimated impact of RTC laws is to different data periods, the use of state versus county data, particular specifications (especially the Lott-Mustard inclusion of 36 highly collinear demographic variables), and the decision to control for state trends.”
This preceding statement alone would make and academician very suspicious of any “however” that follows. However 🙂 the following statement screams out “don’t make policy on these data!”
“In addition to aggravated assault, the most plausible state models conducted over the entire 1979-2010 period provide evidence that RTC laws increase rape and robbery (but usually only at the .10 level). In contrast, for the period from 1999-2010 (which seeks to remove the confounding influence of the crack cocaine epidemic), the preferred state model (for those who accept the Wolfers proposition that one should not control for state trends) yields statistically significant evidence for only one crime – suggesting that RTC laws increase the rate of murder at the .05 significance level. It will be worth exploring whether other methodological approaches and/or additional years of data will confirm the results of this panel-data analysis and clarify some of the highly sensitive results and anomalies (such as the occasional estimates that RTC laws lead to higher rates of property crime) that have plagued this inquiry for over a decade.”
Even the authors don’t understand how the models could produce higher rates of property crime. Perusing the paper it’s clear that this study suffers from the most basic flaw of the anti gun argument; the lack of theory for how any of the crimes listed (not proceeded by the word “gun”) can increase when RTC laws are adopted.
I understand the concern about messaging, but this study provides so many non-results and anomalies that it should be possible for gun rights advocates to Gruberize it into oblivion 🙂
I think a missed point is where the numbers come from. There’s an increase in aggravated assaults in states where laws are changed to allow carrying firearms, either openly or concealed? Police in those states are not used to citizens having weapons and don’t like the change, guess what happens? Good citizens draw their self defense tool in a threatening situation and…. Bob’s your uncle they get arrested for aggravated assault! Go figure.
Comments are closed.