I spend a fair amount of [what’s called] my life trying to inform liberals about the importance and inviolability of Americans’ Constitutionally protected right to keep and bear arms. I sometimes feel like the guy looking for his car keys under the streetlamp because the light’s better. If death is the problem, shouldn’t we be talking about something more statistically significant? Truth be told, “gun crime” is a relatively minor problem that mostly afflicts people engaged in criminal activity (e.g., drug trafficking). If a nutcase hadn’t gone postal on a bunch of white suburban school kids, or if Lanza had been a “proper” terrorist, my liberal antagonists would still be talking about global warming. Still, needs must, and here’s some ammo for the cause. [h/t Dan Martin]


Brilliant. Thank you, Mr. Farago. Thank you, indeed.
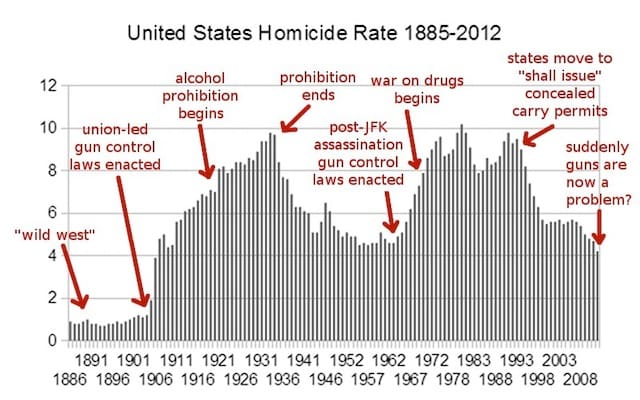
What is the vertical axis? Improperly labeled graphs do not actually convey information
It is the Homicide rate. The title of the graph explains the vertical axis. We don’t know exactly what the numbers mean ( I can assume homicide per 100,000) but we can certainly assume the scale is the same for each year it is easy to understand the information conveyed. We have a homicide rate now that is about 4 times that of the late 1800s.
Among criminologists and sociologists, crime rates are almost always expressed as “incidents per 100,000 population.” If the population group is less than 100,000, then the number of incidents is scaled up to normalize them into a rate/100,000.
Agreed. Never trust an unlabeled graph.
“It’s the homicide rate”: Is that the per capita homicide rate, or the number of aggregate homicides per year?
Further, that’s the *overall* homicide rate, not the *firearms* homicide rate. The two may be loosely correlated, but as many on this site have pointed out, banning guns doesn’t stop people from killing each other.
The top of the graph says what it is…… The bottom obviously is a timeline……
Hubba hubba! That graph got curves!
Motorboat!
Can we get some definitions? Is that the rate per 10,000, 100,000, what?
Wondering why you think it matters. The shape of the graph REMAINS THE SAME. However, if you were you actually eduated about gun violence you would know that the standard homicide rate is deaths per 100,000 per year.
See the graph at
http://billllsidlemind.blogspot.com/2013/02/crime-rates-falling-everywhere.html
(“Crime Rates Falling Everywhere” February 24, 2013 )
comparing homicide rates in prison to the general population.
That has got to be the worst graph I’ve ever seen. There’s no scale on the Y axis. There is no source as to where that information came from. I followed the link to nsearch.com and there are no citations there either.
1968 – Gun Control Act
1993 – Brady Bill
1994 – assault weapons ban
Fair enough, correlation and causation. However, the AWB at least has been shown to have had no effect on crime and murder rates, which is no shock since very few people have ever been killed with these weapons.
and should have added
2004 – assault weapons ban expires
Which did what again, LOL, nothing.
There is more validity to the aging of the baby boomers, born 1947-1964 getting to the age where their criminality declined as being one of the main reasons for the reduction in violent crime and such as they are the largest age subgroup in the US to date!
Yes, it is sometimes disheartening to see how people can play with statistics in order to get their point across. Showing the Wild West era as being peaceful is one of those slights of hand. It is called the on the chart “wild west” but the chart refers to the country as a whole. The actual West at that time was a very dangerous place.
Dodge City as one example (there were small towns in the far West with even higher rates) had a murder rate more than three times the murder rate of the most dangerous modern American city with a homicide rate of 165 per 100,000 vs. Detroit’s 48 per 100,000. Of course this doesn’t count all of those people killed and not counted in the wilds of the 19th century America or those killings not considered homicides, i.e., unlawful killings. In modern America nearly all homicides are accounted for and the definition of homicide is much more encompassing.
In the stats of the West, the deaths in the Indian Wars are rarely counted. There is a trend to say that the 19th century West was not a violent place. I would suggest looking into primary sources before believing these charts and articles. Generally these authors have an adgenda or in some cases just need something shocking and/or controversial to write about. To this day many people believe that the Fall of Rome was caused by lead poisoning due to an article written and reviewed on in the media by doctorate canidate.
We don’t need to resort to lies to make our point. The chart is garbage and I wouldn’t trust it.
Funny how you get different numbers depending on the source. I’m looking at one that shows “In Abilene, Ellsworth, Wichita, Dodge City, and Caldwell, for the years from 1870 to 1885, there were only 45 total homicides” and “Abilene, supposedly one of the wildest of the cow towns, not a single person was killed in 1869 or 1870.” What years were you looking at for the 165 per 100,000 (speaking of primary sources…)
The chart is garbage and I wouldn’t trust it.
You have to do better than that for evidence. the “Wild West” was not so wild by the late 80s and long gone turn of he century. Heck, Earp LEFT Dodge City in 1879. Too boring no doubt.
I think the chart works pretty well to present our case. Not that logic or intelligence are needed by the antigunners.
I doubt Earp left Dodge City because it was boring but rather for financial opportunities in Tombstone, often of the illegal sort.
If you want to read about high murder rates in 19th century Wild West towns Google Pioche NV. It is possible the homicide rate for the entire country was lower in the late 19th century than it is now, I really don’t know. However, the chart does not say ‘wild west era”, rather it says “wild west” which was a geographic location as well as an era. The purpose of labeling it as such was to downplay the violence in the 19th century West, yes, when guns were commonly carried.
Dont’ forget to remind your liberal friends that the OK Corral shootout happened in and because of a “gun free” zone.
Never the less the chart deals with the rate of murder for the nation as a whole and as such is effective.
Great chart. I will post it around.
Not that TTAG is consistent on footnotes, or sound quantitative research methods (thank the gods that Kopel, Lott, et al., are) even in their simplest form…but that “union led gun control laws” tag on the bar graph made me laugh out loud.
I think if you’re going to indulge a taste for the post hoc ergo propter hoc fallacy as an excuse to flame and blame, Robert, you should also note that 1905 was the year that Pope Pius published Vehementer nos, Bill Dineen pitched a no-hitter against the White Sox, Einstein published an articulation of his “E=mc^2” equation, and the /Potemkin/ mutiny. Maybe that’s what caused the uptick in homicide rates. Or maybe it was the passage of the Dawes Act in 1882. Some things take awhile to set in.
Or you could just append to each blog entry, “DAMN I HATE UNIONS.” I can respect an honest opinion. But lazy presentation of purportedly quantitative data is tacky and undercuts INTELLIGENT quant arguments made around gun violence and gun control policy. I can’t send intelligent citizens here for the latter when they repeatedly see scrotum-shrivelers like bar graphs without properly labeled X and Y axes.
First off, RF did not create the graph. A little time with Google shows that this graph in one form or another has been kicking around for several years with the earliest reference I can find is 2009. Some website say it was developed by the FBI Crime stats. I am unable to find the original author but it was not TTAG.
Second, the graph is provided as one more piece of information
Finally, since you seem to be all knowing, why don’t you use your time to give us the proper graph that you believe we should have.
Why waste all that space. You appear to be anit 2a, pro collectivist, and a quasi intellectual. So what brings you here? Changing hearts and minds or just spitting out anger. To gun grabbers “be reasonable” = “do it my way, or I’ll circumvent the law “. The only argument I can give you regarding your intelligent, though baseless argument(s), is “Shall not be infringed”. And no matter how many attempts are made to redefine the words or the intent of the 2nd, in the context of of it’s times and the repeated extermination of unarmed populous, it is beyond clear that the basis of our freedom is contained in the recognition of our natural right to KABA.
I would like to review at this point, the successful disarmament of The Lakota People in South Dakota(you remember them, they were Indians. The people who’s land this was/is), USA. On December 29, 1890 150 men, women, and children of the Lakota Sioux were killed and 51 wounded, ( along with 31killed and 33 wounded of their own men) by the brave 7th Cavalry’s four 1.65-inch (42 mm) light mountain Hotchkiss guns, along with small arms fire . For this display of courage and bravery in facing women and children, 20 noble Calvary men were awarded the CMH. So goes gun control/confiscation.
Curious that the Union Led gun control enactment was followed by an enormous and extended rise in the homicide rate.
Especially curious since there was no such law.
Shows Democrates are facsit like Joe Girbles who said when you lie, LIE BIG!!!
Goebbels. (…smh…)
Numbers before roughly 1910 are not accurate at all. The vast majority of states did not require death certificates. Those laws started to become common around the early 1900’s. I know these numbers very, very well and everything after about 1906 on this chart is accurate. I don’t agree with all the annotations as it’s just not that simple. You can get data from the FBI back to 1930, before that is a bit more difficult.
I like the story this tells, but let’s at least try to be fair about the facts. The omission of the NFA of 1934 makes this nothing more than biased facebook material.
What would the 1934 NFA point add to the discussion? It happened while the homicide rate was falling. The declining homicide rate at the time was a result of the repeal of the 18th amendment, not the result of the NFA.
Anybody know what those early-1900s gun control laws were? I was under the impression that aside from the Jim Crow laws, there basically wasn’t any gun control (as we know it) until 1960s when people started freaking out about handguns.
I’m thinking you’d do better to lay the blame on poverty, economic depression, and accelerated urbanization… But then what do I know?
Some laws were state laws prohibting felons from buying guns and were pushed by, get this, yes, the NRA.
Careful, if you make sense, and provide facts the progressives and leftys will start name calling as they think that it will all arguments. I mean the more childish the name calling that you get the more spot on you are with the facts.
Good intent, possibly great info, but poor presentation. The chart would be way better (read: more useful) with a labeled vertical axis, some form of citation for source(s), and a fair presentation of all gun-related events (such as the NFA act), even if they don’t help our case.
Fancy knocking one up for us? Oh please. [email protected]
The left does not care about facts. The Democrats and their minions want to take away our guns for reasons other than “the kids.” If charts and facts could sway their opinion, this debate would have been over a long time ago. Why can’t we just put our efforts into exposing them for who they are: socialist, freedom-hating control freaks.
Homicide rate may not be the best measure. One thing to keep in mind is that medical science has improved dramatically since the peaks in the 1970’s and 1980’s. So given the same number of shootings, today fewer people would die than 20 to 30 years ago. It may be as much a triumph of medical science as a reduction in shootings. I’d be more interested in seeing the rate of “gun-related” violence overthe period as it would be a better measuring stick for these purposes.
Medical trauma care may have improved but the simple fact is if your aren’t alive when they get to you, or the cumalative damage is just too much, the level of care is irrelevant.
Per FBI UCR the % of crimes with which a firearm was used to kill with is consistently between 67%-68%, and consistent in the % it is used in robbery, aggravated assault, rape since the 1990’s and since violent crime is down, really hard to believe there are more shootings and more injuries.
Then again since suicide by firearm is 90% lethal, only 15% of targets fired at are hit, 1 dead and 6 wounded for every 7 hit and those % really havent changed in 2 decades, really doubt that medical care is the reason.
Dead is dead, this is what it is about DEATH rates, not may have died but did die.
Shootings have dropped dramtically also.
The homicide rate rose steeply with immigration from Italy and Czarist Russia. Both brought a large proportion of gangsters along with them. The sharp rise in the murder rate reflected the war between the Irish on one side and the Italians and Jews on the other. The gang wars peaked during prohibition. The drop off after prohibition was not the result repeal but the fact we had winner — the Italian-Jewish mob. The murder rate never returned to its pre-immigration levels because the various mob families still had their disagreements.
What is the cause of the second spike? Like everything else the Boomers produced more criminals because of the size of the generation. Why did it peak again during the 80’s and then drop off again? Two reasons: The Feds broke up the Italian-Jewish mob and a new criminal organizations moved in to fill the gap. The murder rate started falling as the Boomers aged and the criminal element either moved on, went to prison or the grave. We also had winners in the drug wars so the fight for turf was pretty much over. These two factor probably account for most of the decline in the murder rate.
Here ia a prediction for you. As the demographics of the entire country are beginning to take on an inner city cast, you can expect a rise in the murder rate starting in next decade as the children of single mothers come of age.
It’s a rate, not a quantity, so it is independent of the size of the population. Baby boomers getting too old to commit crime is not really relevant.
I think tdiinva made a good observation. we can look at murder rates and then also offset the chart based on urban vs rural settings. the higher the concentration of people per acre, the higher percentage you will have of violent crimes. We will also see a rise when Single mother parenting becomes more of the norm than a 2 parent traditional family.
We will never see True statistics until we are willing to look at the contributing factors. Prior to firearms, we still had unthinkable slaughtering of people whether for belief or desire of power possessions or status. As we change dynamics of population concentrations, cost and availability of firearms, Sociological trends and a simple comprehension of right and wrong, we will alter the incidence percentages of firearms.
The chart is based on the homicide rate, not total homocides, so it is independent of the size of the population. The Baby Boom is not relevant, as the age of “I am too old to make a living as a criminal” should remain relatively the same (although probably gradually increasing with general longevity).
I would like to see some references to back up the “mob wars” theory. That’s a new one on me.
+1 for the demographic changes. Look at what happened in Colorado. Bunch of lazy ignorant hippies screwing over the whole state.
I really wish there were more arcielts like this on the web.
this also could be a graph of republican vs democratic presidents.