You can be the best shooter in the world and have the most accurate rifle known to man, but if your ammunition is inconsistent you’re still going to suck. From High Power Rifle all the way down to 3-gun and USPSA, when centimeters matter you have to know that you can trust your ammo. But which brands are really the best?
Just about every brand of ammunition these days has a “match grade” line boasting improved consistency for the precision shooter. Starting today and continuing until we run out of brands to test, I will be putting every box of match grade ammunition I can find to the test and keeping a running tally of which brand will give you the best consistency.
When we talk about consistency in ammunition we’re really talking about speed. Three factors most affect the speed of the round: bullet weight, powder charge, and barrel length.
By keeping a standard barrel length (or rather just a standard test rifle) any variation in the speed of the bullet will indicate that there is either an issue with the consistency of the bullets or the consistency of the powder charge. There will always be some variation in the speed of the rounds. But the ammunition that comes the closest to having no variation in speed at all would obviously be the preferred ammunition for consistent shots.
The only truly objective method of testing ammunition consistency is using a chronograph and measuring the speed of the bullets as they exit the barrel. Even if we were to strap a rifle to a slab of concrete so it doesn’t move, fire the test rounds and examine the resulting target, any variation in the group size might be due to barrel imperfections instead of issues with the ammunition. Therefore we will use bullet speed as the yardstick against which we will measure these rounds.
Testing Procedure
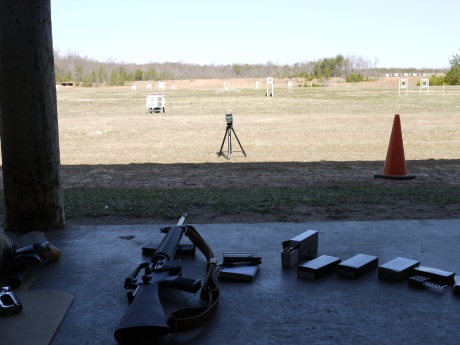
Using a National Match Service Rifle style AR with a 20 inch barrel and 1:8 twist rifling, I fired 10 rounds of each brand of ammunition from the prone position over a chronograph situated exactly 12 feet from the end of the muzzle. I recorded the velocity of each round as reported by the chronograph.
To create useful data charts, all velocities were “normalized.” I found the average velocity of the 10-round string of shots, and then subtracted from each of the recorded velocities. This yielded a set of numbers, some positive and some negative, with the mean being zero. I then analyzed the normalized plots.
To compare the ammunition, the interquartile range or “IQR” will be determined. IQR is established by figuring-out which two velocities 50% of the rounds fall between, and then determining the distance between those velocities. The IQR will be the value by which the ammunition brands are ranked.
Ammunition Brands to Test
Wilson Combat donated two boxes of their match grade ammunition as well as two boxes of other brands for the test, and I threw in a box of Wolf and a box of my own handloads.
- Wilson Combat 77gr Match
- Wilson Combat 65gr
- Winchester 64gr
- CorBon 69gr
- Wolf 55gr
- My own personal handloads
Results
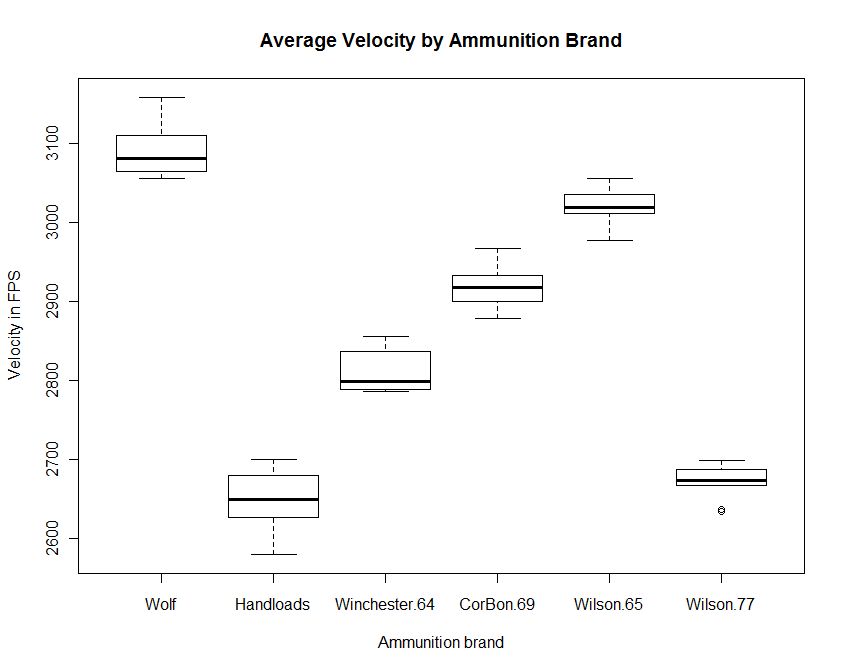
The non-normalized results were somewhat confusing.
However, the normalized results were much easier to understand.
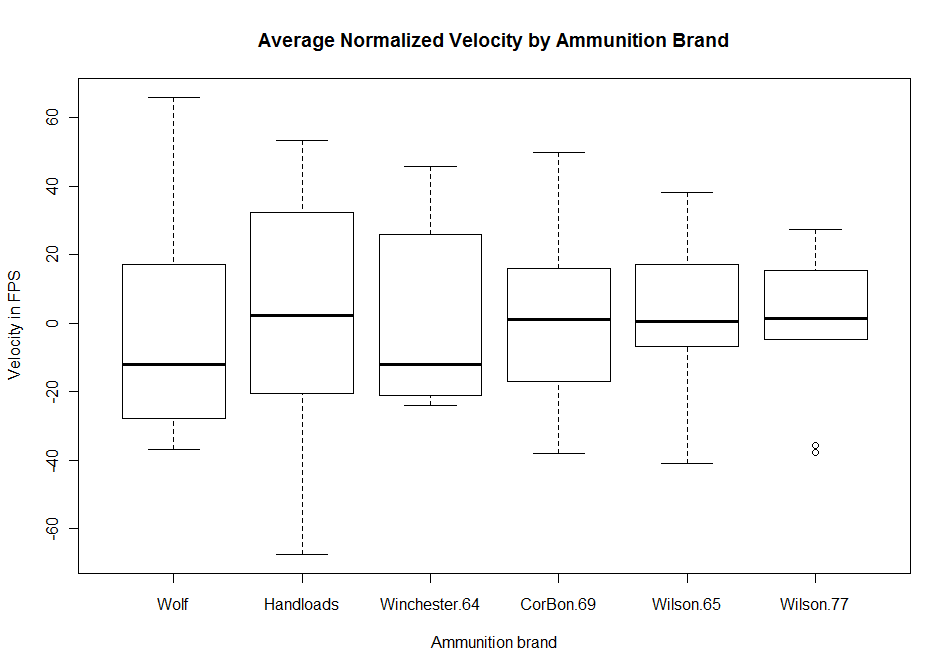
This is what’s called a boxplot. I suggest you read the Wikipedia article on it, but the basic concept is that the area of the box represents the location of 50% of the observations, and the dotted lines extend out to solid lines represent the location of the largest and smallest observations. The thick black line is the median, separating the lowest five observations from the highest five observations. The ideal boxplot will have the black line centered in the box and whiskers extended equally to both sides.
In terms of the data points being “normally distributed” the handloads and the CorBon 69gr rounds are the closest, but most of the ammo appears to be forming a nice, normal distribution around the mean. The only ammo that worries me is the Winchester 64gr ammo, which has a distribution skewed more towards the lower end of the spectrum. Further testing should be conducted to see if this type of skew is typical in Winchester ammunition and to ensure that the results provided by this sample of 10 rounds properly represents the ammunition produced by Winchester.
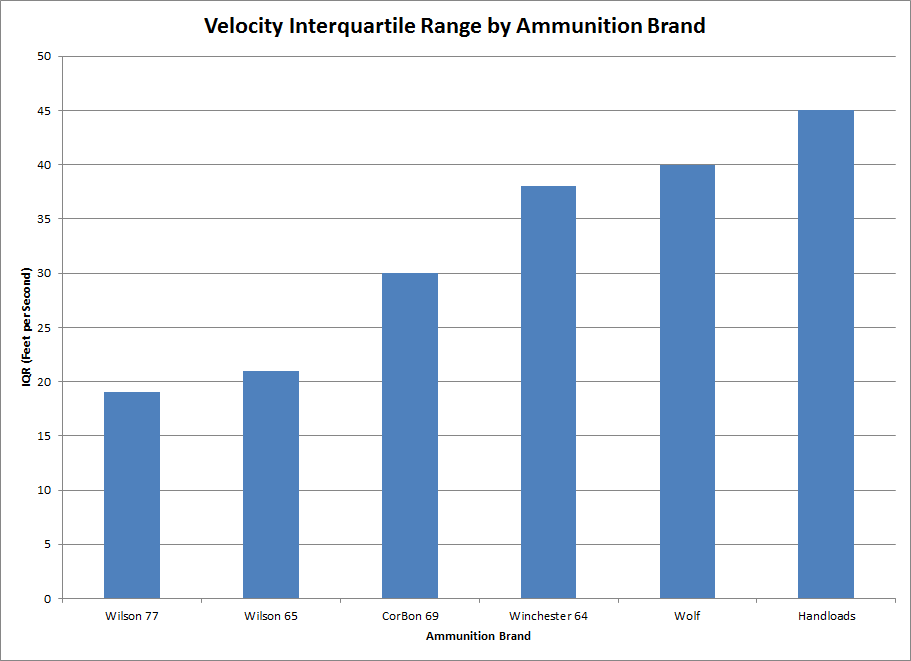
The IQR really says it all (smaller is better). In terms of consistency, currently Wilson Combat takes the prize. But with more ammunition on the way, can Wilson Combat stay on top? Just how good is that Hornaday match grade stuff? Will Foghorn stop asking leading questions?
Tune in next time to find out.
| Brand and Weight | Caliber | IQR |
| Wilson Combat 77gr Sierra HPBT Match |
.223 Rem | 19 |
| Wilson Combat 65gr Sierra SP BT |
.223 Rem | 21 |
| CorBon 69gr HPBT |
.223 Rem | 30 |
| Winchester 64gr “Power Point” SP |
.223 Rem | 38 |
| Wolf 55gr FMJ |
.223 Rem | 40 |
| Handloads – 21gr IMR 3031 75gr Hornaday HPBT Match |
.223 Rem | 45 |


Could you compare and contrast using the IQR statistic with using the standard deviation statistic? The STD expressed as a percentage of the Mean, the coefficient of variation (CV), seems useful. The rule of thumb I’ve read is that for rifle loads a good CV should be under 1.0.
A different but related question, what might be the sources of the variability in velocity? The quality of the gunpowder? Inconsistent weight of the bullets? Inconsistent weight of the gunpowder? Inconsistent primers? Why would the hand loads have the highest IQR?
I would be pleased as punch to discuss your questions.
The biggest difference between IQR and CV is that CV is a normalized ratio while IQR is a more concrete number. The range of a CV floats, with smaller tolerances for lower velocities and larger tolerances for higher velocities, but the IQR is a definite number no matter what the velocity involved.
For example, let’s say I have two rounds, one with a 1,000 fps mean velocity and another with a 2,000 fps mean velocity. If I chronograph a sample of both of these rounds and find that the 1k fps round has a standard deviation of 40 but the 2k fps rounds have a standard deviation of 80, they would have identical CV ratios (0.04) but very different IQRs.
The question being tested is which ammunition is the most consistent. Consistency in this test is defined as the smallest deviation from the mean velocity. It may turn out that there is a direct correlation between faster velocities and larger IQR but in long range competitions speed is no good unless the point of impact is consistent.
This means that slower rounds may indeed have an advantage given the goals of this test, an advantage I do not want to discourage. When choosing a round for use based on the data I am providing, shooters should consider which ammo (in terms of bullet weight and speed) is best suited for them, and then ensure that the brand they are using has the smallest IQR. IQR should not be the sole basis for their decision to pick one round over the other.
BTW, here’s a table with all the relevant CVs. As you can see, the two metrics provide roughly the same ranked order of the ammunition brands.
Brand – IQR – CV
Wolf – 45 – 0.0120
Handloads – 40 – 0.0143
Winchester 64 – 38 – 0.0092
CorBon 69 – 30 – 0.0087
Wilson 65 – 21 – 0.0078
Wilson 77 – 19 – 0.0082
In terms of the issue I’m seeing with my handloads, I have no idea what the hell is going on. I have another powder brand I’m going to try in the next batch, we’ll see if the powder is the issue. If not I might have to ditch this RCBS beam balance for something else.
Time to buy a powder thrower (or better yet, a bench mounted press), Señor Leghorn.
Those looks like R box plots
I <3 R
I will note that you only have seven degrees of freedom in your samples for each ammo brand. N – 2. Is any chance that data with a larger sample might exhibit some funky multinomial distribution? I have been pondering that all morning. Obviously it should not as anything outside of half a standard deviation should not arise with modern manufacture, but in a large enough sampling would it begin to approach a more multinomail instead of standard distribution.
I also prefer the CV ratio due to an abnormal love of stabdarding units.
Excellent analytical post!
In a perfect world, I would get a pallet of each brand of ammunition and spend days on end happily chronographing thousands of rounds for each test. Unfortunately, due to time and ammunition availability constraints, 10 rounds is the best I could muster.
True, each box that I tested (including the handloads) had 20 rounds inside. But I am anticipating changing rifles very soon from a Rock River Arms NM AR to an ArmaLite NM AR and wanted to be able to re-chronograph the ammo and confirm that there was little to no difference in the firearms, and what better ammo to use than ammo from the same box?
According to the CLT, the larger the sample size the closer the distributions will be to normal. Based on the boxplots I believe that larger samples would only lead to a more normal distribution, but the boxplots only represent the sample and not the population so I cannot form a definite conclusion based on the given information. However, given the nature of the possible causes of error (light loads, improperly mixed powders, misshapen bullets, etc) it seems unlikely that a multinomial distribution would emerge instead of a normal distribution.
Very true the latency makes it likely to approach normal. My comment on degrees of freedom arrose out of interest in seeing larger samples of 32 shots. That way you would still have around 30 degree of freedom. Obviously you are not running complex statistics it would just give me more of a hand on how the sample variance begins to approach the population.
By the way what are you thoughts on the issues with your hand loads? Could it be lack of humidity control that is affecting the velocity?
I think it’s an issue with the powder not burning consistently. I used IMR 3031 this time around, I’m going to use VIHT N-135 next time and see if it helps.
I actually understood at least part of this thread, which leads me to believe that I’m spending too much time playing with my guns and not enough time shagging my GF.
Worse, I understood most of this because I spend too much time playing with numbers instead of my wife, or guns!
That is my weapon, this is my gun. That is for killing, this is for fun.
Concerning sample size I wonder if using more than 10 observations is worth the expense. Fewer might be OK. From what you’ve published I’d estimate that your hand load MV is around 2650 with a SD of around 38. The sample error of the mean (if this in fact is a useful statistic here) is related inversely to the square root of the number of observations: SEM = SD / sqrt(n).
Given SD = 38 then for 10 samples SEM = 12.03, for 20 samples SEM = 8.50 and for 30 samples SEM = 6.93. The practical question is just how small does this need to be? Is 5.1 fps refinement (e.g. 12.03 – 6.93) of the Mean worth shooting 30 instead of 10 shots? Maybe 5 shots giving SEM = 16.96 is sufficient.
Probably I’m in over my head statistically but I’d like to understand since this relates to my own reloading adventures.
I got tired of trying to calculate sample sizes by hand (and a bit lazy) so I found this site to do it for me:
http://www.raosoft.com/samplesize.html
Considering the massive population (thousands and thousands of rounds produced) the sample would likewise need to be massive (hundreds of rounds) to get anywhere above 90% confidence in the results. That much ammo testing is impractical for us. Going forward all ammo will be tested based on a 20 round sample size, 20 rounds being the number usually sold per box. If ammo manufacturers want more accurate results, they have my mailing address and know what to do.
I did something similar to this with my wifes 20″ NM AR but added that I shot each batch into a different target at 100yds and measured group size overall, vertical and horizontal to look at accuracy in her gun as well as consistency. Have to dig out the data and compare to yours. I know that John The Texaner and HSOI have both done some similar searching. Might be interesting to combine data groups and see what we come up with.
I would be very interested to compare notes.
nick dot leghorn at the google email thinger is my email address (goddamn spam spiders…)
Can we just go back to RF posting pix of hot chicks and guns…. 🙂
I use WC almost exclusively, it’s pricy but you really get what you pay for